Fetching Table-Level Statistics with Oracle GoldenGate REST API
Monitoring replication activity at the table level is critical for DBAs and architects who need fine-grained insights. Starting with GoldenGate Microservices, this becomes simple through the REST API Metrics service.
Why Table-Level Metrics Matter
Table-level metrics allow you to:
- Track replication activity per table
- Detect hotspots with heavy DML traffic
- Validate whether DDL is being captured and applied correctly
- Troubleshoot lag and performance issues down to a single table
REST API Endpoint
The API provides table-level statistics under:
GET /services/v2/metrics/streams/{deployment}/tables
Where {deployment} is the name of your GoldenGate deployment (for example, LocalDemo).
Query Parameters (Filters)
You can refine your request using optional filters:
process→ Extract or Replicat nameschema→ schema nametable→ table namedetail→ true/false for extended metrics
Example:
curl -X GET \
  "http://localhost:9011/services/v2/metrics/streams/LocalDemo/tables?schema=HR&table=EMPLOYEES&process=Replicat1&detail=true" \
  -H "Authorization: Basic <base64-credentials>"
Sample Response
[
  {
    "deployment": "LocalDemo",
    "process": "Replicat1",
    "schema": "HR",
    "table": "EMPLOYEES",
    "inserts": 120,
    "updates": 450,
    "deletes": 30,
    "ddls": 2,
    "last_updated": "2025-08-19T15:22:41Z"
  }
]
This output shows per-table activity: inserts, updates, deletes, and DDLs.
Automating Multi-Table Queries
Because the endpoint only supports filters as query parameters, you can’t post a JSON payload directly. But you can simulate this by looping through a file of schema/table/process entries and dynamically building REST calls.
Here’s a simple bash + curl + jq approach:
while read -r schema table process; do
  curl -s -X GET \
    "http://localhost:9011/services/v2/metrics/streams/LocalDemo/tables?schema=$schema&table=$table&process=$process&detail=true" \
    -H "Authorization: Basic <base64-credentials>" | jq .
done < filters.txt
With filters.txt:
HR EMPLOYEES Replicat1
HR DEPARTMENTS Replicat1
SALES ORDERS Replicat2
Script Example: Dynamic Table-Level Stats Query
Suppose you keep your filter list in a file called filters.txt with this format:
HR EMPLOYEES Replicat1
HR DEPARTMENTS Replicat1
SALES ORDERS Replicat2
You can then write a bash script (get_table_stats.sh):
#!/bin/bash

# GoldenGate REST API connection
GG_HOST="http://localhost:9011"
DEPLOYMENT="LocalDemo"
AUTH_HEADER="Authorization: Basic $(echo -n 'oggadmin:Welcome##123' | base64)"

# Input file with filters: schema table process
INPUT_FILE="filters.txt"

while read -r schema table process; do
  echo "Fetching stats for $schema.$table (Process: $process)..."

  curl -s -X GET \
    "$GG_HOST/services/v2/metrics/streams/$DEPLOYMENT/tables?schema=$schema&table=$table&process=$process&detail=true" \
    -H "$AUTH_HEADER" \
  | jq .

  echo ""
done < "$INPUT_FILE"
This way, it feels like a payload-driven batch request, but under the hood, it’s still just GET+query params (what GoldenGate expects).
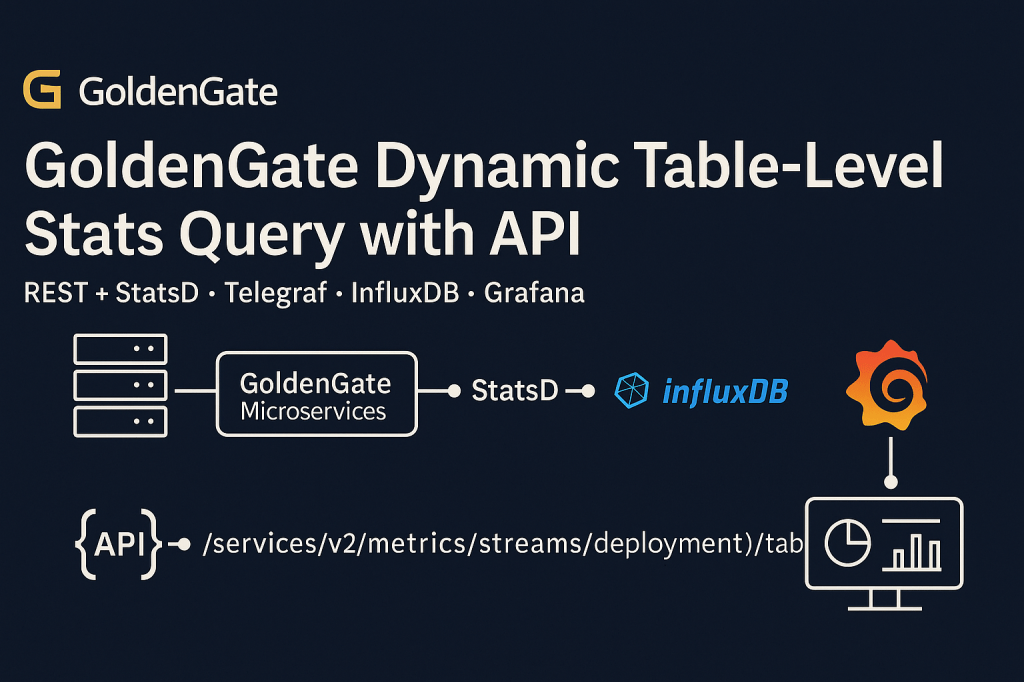
REST + StatsD = Full Observability
- REST API → perfect for ad-hoc queries, scripts, automation, or feeding into CI/CD pipelines.
- StatsD → Telegraf → InfluxDB → Grafana → ideal for continuous monitoring, dashboards, and alerting.
Together, they give DBAs fine-grained control and a 360° view of replication health.
Conclusion & Final Takeaway
GoldenGate 23ai and newer releases deliver modern observability hooks out of the box. The REST API provides a powerful and flexible way to query replication activity without parsing logs or relying solely on GGSCI, giving DBAs and architects visibility into exactly what’s happening at the table level.
At the same time, by wiring GoldenGate’s StatsD output into Telegraf, InfluxDB, and Grafana, you can move from ad-hoc troubleshooting to continuous dashboards, historical analysis, and alerting.
Together, REST and StatsD make replication visible, measurable, and reliable — whether you’re scripting automation, validating health checks, or building real-time observability dashboards.

Leave a comment