
Working with Oracle GoldenGate’s REST APIs unlocks a powerful level of automation and integration, but figuring out the exact endpoints, payloads, and headers for each call can sometimes be challenging.
OGG’s official documentation is comprehensive, meaning it’s technically complete, though it might not always be intuitive for new users or non-developers.
In this post, I’ll share several practical ways to identify and build your own GoldenGate API calls, whether you’re a developer, DBA, or automation engineer.
1️⃣ Start with the Official GoldenGate REST API Documentation
The single source of truth for all GoldenGate REST endpoints is the official Oracle documentation:
🔗 Oracle GoldenGate 23ai Microservices Architecture REST API Documentation
This documentation lists all available services, methods, and payload structures for the current release (23ai). Always start here before exploring other tools or workarounds.
2️⃣ Use the Admin Client Debug Mode
The GoldenGate AdminClient can reveal the actual REST calls used by the system.
To enable this, simply run:
SET DEBUG ON
Once enabled, every command you execute (such as ADD EXTRACT, CREATE PATH, or INFO REPLICAT) will display the corresponding REST API call, including endpoint, method, and payload.
You can then capture this output and reuse it to build or customize your own API requests.
3️⃣ Review the REST API Log File
GoldenGate automatically logs all REST API activity, regardless of whether it comes from the Admin Client, Web UI, or external tools.
You can find this file at:
$OGG_DEPLOYMENT_HOME/var/log/restapi.log
This file contains the history of API calls made to your deployment, invaluable when reverse-engineering the payloads used by the UI or diagnosing integration issues.
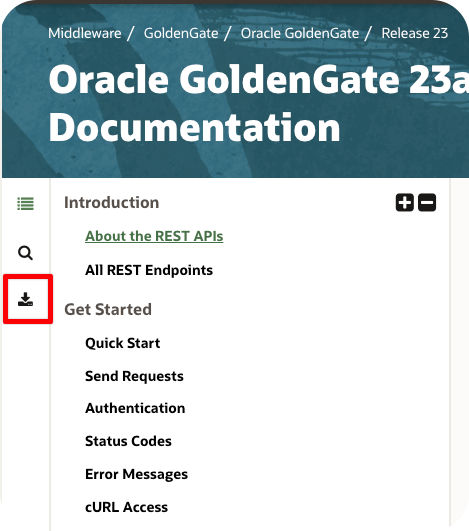
4️⃣ Explore the Swagger (OpenAPI) Specification
GoldenGate’s REST API documentation includes a link to download the official Swagger (OpenAPI) specification file.
Once you have it, there are several ways to visualize and work with it:
- Swagger Editor: Upload the file to swagger.io for an interactive API view.
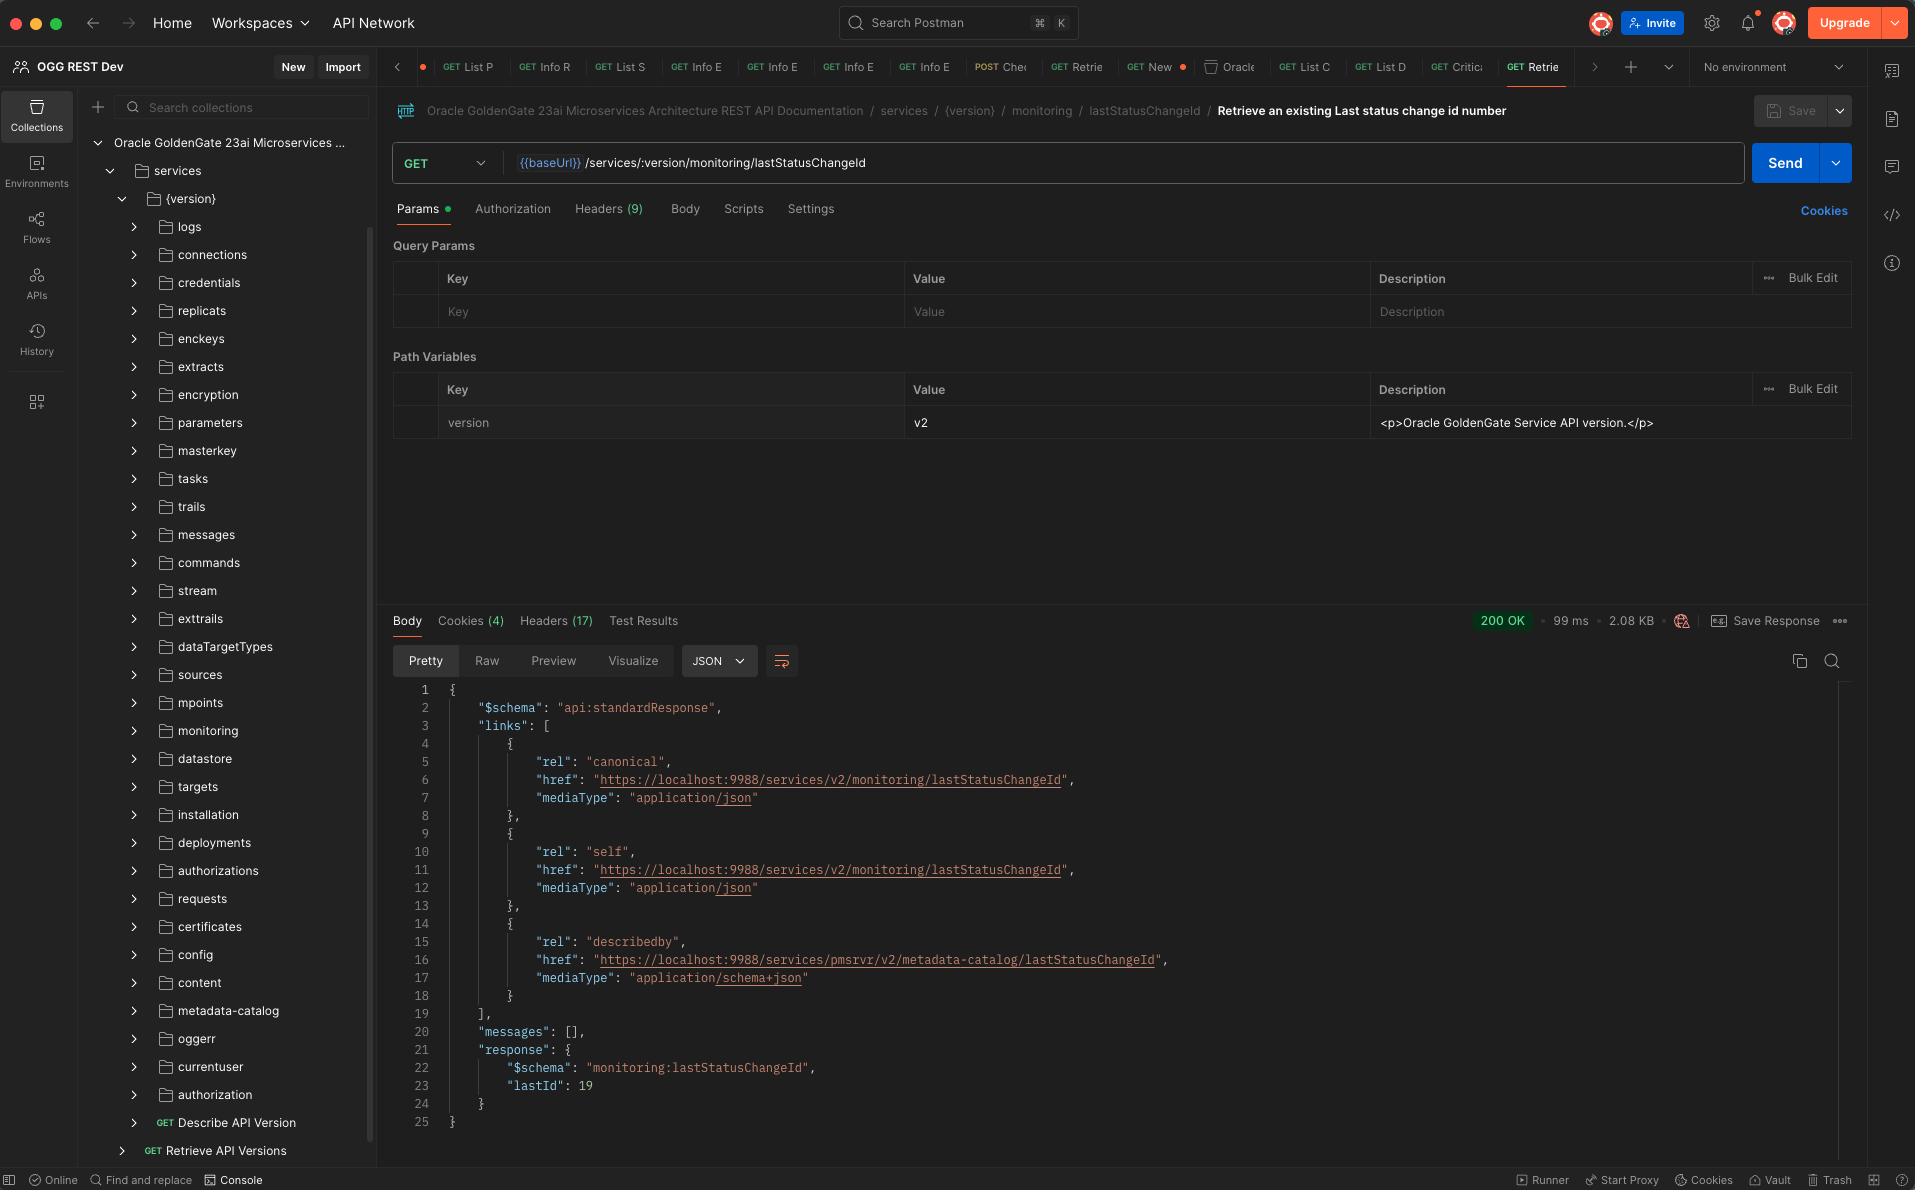
- Postman: Import it into Postman to automatically generate and test REST calls in a clean workspace.
- My SwaggerHub Reference: You can also view my curated version directly here:
🔗 GoldenGate 23ai API Docs on SwaggerHub
Each of these tools lets you explore endpoints, inspect request/response formats, and experiment safely with mock servers or live connections.


Postman:
5️⃣ Use Browser Developer Tools
If you prefer to learn by observing the GoldenGate Web UI itself, your browser can help.
- Open the Developer Tools in Chrome, Edge, or Firefox.
- Navigate to the Network tab.
- Start performing actions in the GoldenGate Web UI, such as creating Extracts, adding Connections, or starting Replicats.
Every action you take triggers a REST API call behind the scenes, which you’ll see live in the Network panel, including the exact endpoint, method, and JSON payload.
This is one of the most practical ways to capture real examples directly from a running deployment.
6️⃣ Use an LLM to Explore the API
For a more modern, conversational approach, upload the Swagger (OpenAPI) file into an LLM such as ChatGPT, Gemini, or NotebookLM, and interact with it using natural language.
For example:
“Show me a sample payload to create a Replicat in GoldenGate 23ai.”
“What are the required parameters for/services/v2/deployments/{deployment}/connections?”
The LLM can parse the schema and generate realistic examples, helping you quickly assemble payloads or troubleshoot syntax.
Wrapping Up
Building GoldenGate REST API calls doesn’t have to be guesswork.
By combining the official documentation, Admin Client debug mode, RESTAPI.log, Swagger tools, browser developer tools, and even LLM-based assistance, you can confidently explore and automate any GoldenGate operation.
Whether you’re scripting Extract creation, automating deployments, or integrating with external platforms, these approaches will help you understand exactly how GoldenGate communicates and how you can leverage it.

Leave a comment